Which breaks first, stock prices or uncertainty?
by Burt White, CIO, LPL Financial
KEY TAKEAWAYS
- Longer-term technical indicators on equities continue to look strong.
- Sentiment is mixed, but with uncertainty high, the potential for increased market volatility is on the rise.
Some significant technical trend lines are in play, so we take a closer look at market technicals and sentiment this week. The longer-term technicals continue to look strong, and an evaluation of global market breadth suggests the path of least resistance remains higher for stocks. However, sentiment remains a much more mixed picture indicating that market volatility could finally be heating up.
Long-Term Trendlines Support Higher Prices
It is easy to get lost in the daily news cycle, but a longer-term view can help put things in perspective. Two popular long-term trend lines used in technical analysis are the 50- and 200-day moving averages (MA). We have seen interesting developments in both indicators recently.
A 50-day moving average is the average of the previous 50 closes. Likewise, a 200-day moving average is the average of the previous 200 closes. Both are technical indicators used by trend followers.
First up, on Thursday, April 12, the S&P 500 Index closed beneath the 50-day MA for the first time in 105 days [Figure 1]. This was the longest streak above the 50-day MA since 130 days in a row nearly six years ago. Could this be a sign of coming technical weakness? Going back to 1950*, the S&P 500 was above the 50-day MA for at least 100 days 14 times, and the performance after the initial close beneath this trend line did not suggest the start of a major breakdown. In fact, three months later the S&P 500 was up 2.2% on average, slightly higher than the average three-month return of 2.1%. Six months later gains have been slightly below average (3.8% versus 4.3%), but still higher 10 out of the 13 times.
*Please note: The modern design of the S&P 500 stock index was first launched in 1957. Performance back to 1950 incorporates the performance of predecessor index, the S&P 90.
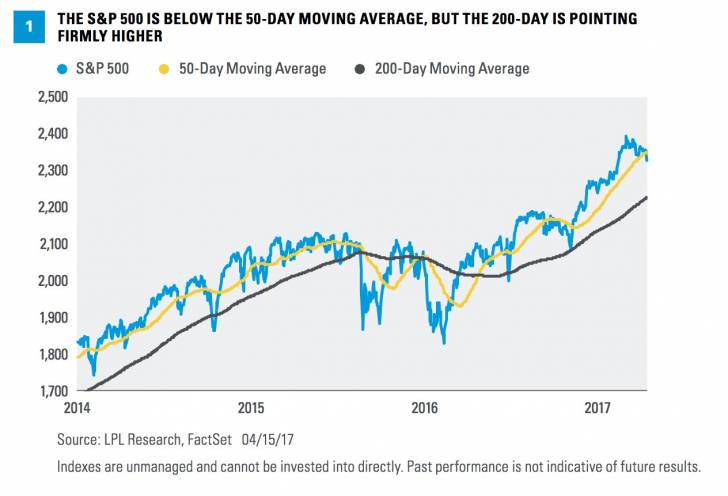
Turning to the 200-day MA, it is 4.3% below current index levels and continues to trend higher. In fact, it has closed at a new all-time high every day since last Halloween (October 2016). As you can see in Figure 1, this trend line provided nice support on the pre-U.S. election weakness and has been firmly pointing higher since rising last summer. With both the 50-day and 200-day moving averages trending higher, this is a sign that the technical backdrop remains strong and any weakness could be a buying opportunity.


